
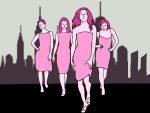
Transparency Item: This is the opinion and perspective of the writer. "Sex and the City" is widely regarded as one of the most popular T.V. shows of all time and had a strong influence on the fashion of the early 2000s. It went on to have two movie spin offs and a sequel show called “And Just Like That…” which was fairly well received in its own right. This … [Read more...] about Walking In Their Heels: A Reader’s Guide to ‘Sex and The City’
the Graphic
Women’s Soccer Shuts Out Saint Mary’s
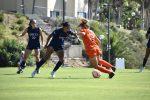
Pepperdine Women's soccer defeated Saint Mary’s in a 3-0 shutout Saturday Oct. 7 at Tari Frahm Rokus Field. This win helped the Waves to improve to 2-1 in conference play and 5-3-5 overall. The game proved to be physical from the start, with a total of five yellow cards distributed throughout the 90 minutes. “We knew they were going to come out strong, but we couldn’t … [Read more...] about Women’s Soccer Shuts Out Saint Mary’s
Opinion: Visit Movie Theaters

Transparency Item: The Perspectives section of the Graphic is comprised of articles based on opinion. This is the opinion and perspective of the writer. I have always loved seeing movies in the theater. The first film I can remember watching in the movie theater was "Ponyo," and I was instantly dazzled by the whole experience. Picking out candy, popcorn and a fun drink … [Read more...] about Opinion: Visit Movie Theaters
Opinion: Not All Friends Can Be Roommates
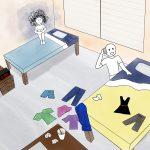
Art by Emma CreesTransparency Item: The Perspectives section of the Graphic is comprised of articles based on opinion. This is the opinion and perspective of the writer.For many students, the beginning of the academic year marks the start of new roommate combinations. Some students make the choice to live with friends they have made during their time in school. This can be a … [Read more...] about Opinion: Not All Friends Can Be Roommates
The Future of the Switzerland Program

As Seaver College students receive International Programs decisions, Graph Host Abby Brown, and Assistant News Editor Fiona Creadon discuss the plans for the future of the Switzerland Program. The future of this IP program is now more important than ever as the university prepares to transition from Maison Du Lac in Lausanne to Chateau d'Hauteville beginning with an official … [Read more...] about The Future of the Switzerland Program