
Without the opportunity to tour campus in person, this year’s Pepperdine applicants will base their decisions on what they find online. Statistics help influence applicants’ views of the University, especially in comparison to other schools.
Understanding Pepperdine by the numbers requires two different kinds of statistics — institutional and social. Institutional statistics include average test scores and class sizes, while social statistics include political affiliations and racial diversity. Some statistics fit in both categories, like the number of scholarship recipients.
Elsewhere in this special edition, readers can find more in-depth stories about nearly every topic mentioned here and more. Here, readers can find an overview of some statistics that define Pepperdine — especially to people outside its community — and give it its top-50 ranking.
“I always thought Pepperdine was not that prestigious — just a private school in Malibu,” first-year student Chris Chang said. “I didn’t know it was this prestigious and highly ranked, so that caught my attention.”
Institutional Statistics
Of any group outside the Pepperdine community, applicants have the most interest in the University’s statistics. Students researching colleges compare statistics, institutional and social, among schools. Chang and fellow first-year student Daniel Hidalgo both said institutional statistics were their top considerations.
“What I was looking at was the professor–student ratio,” Hidalgo said. “Thirteen to one at Pepperdine, which I thought was really amazing because that means professors can focus more on their students and give them the help they need.”
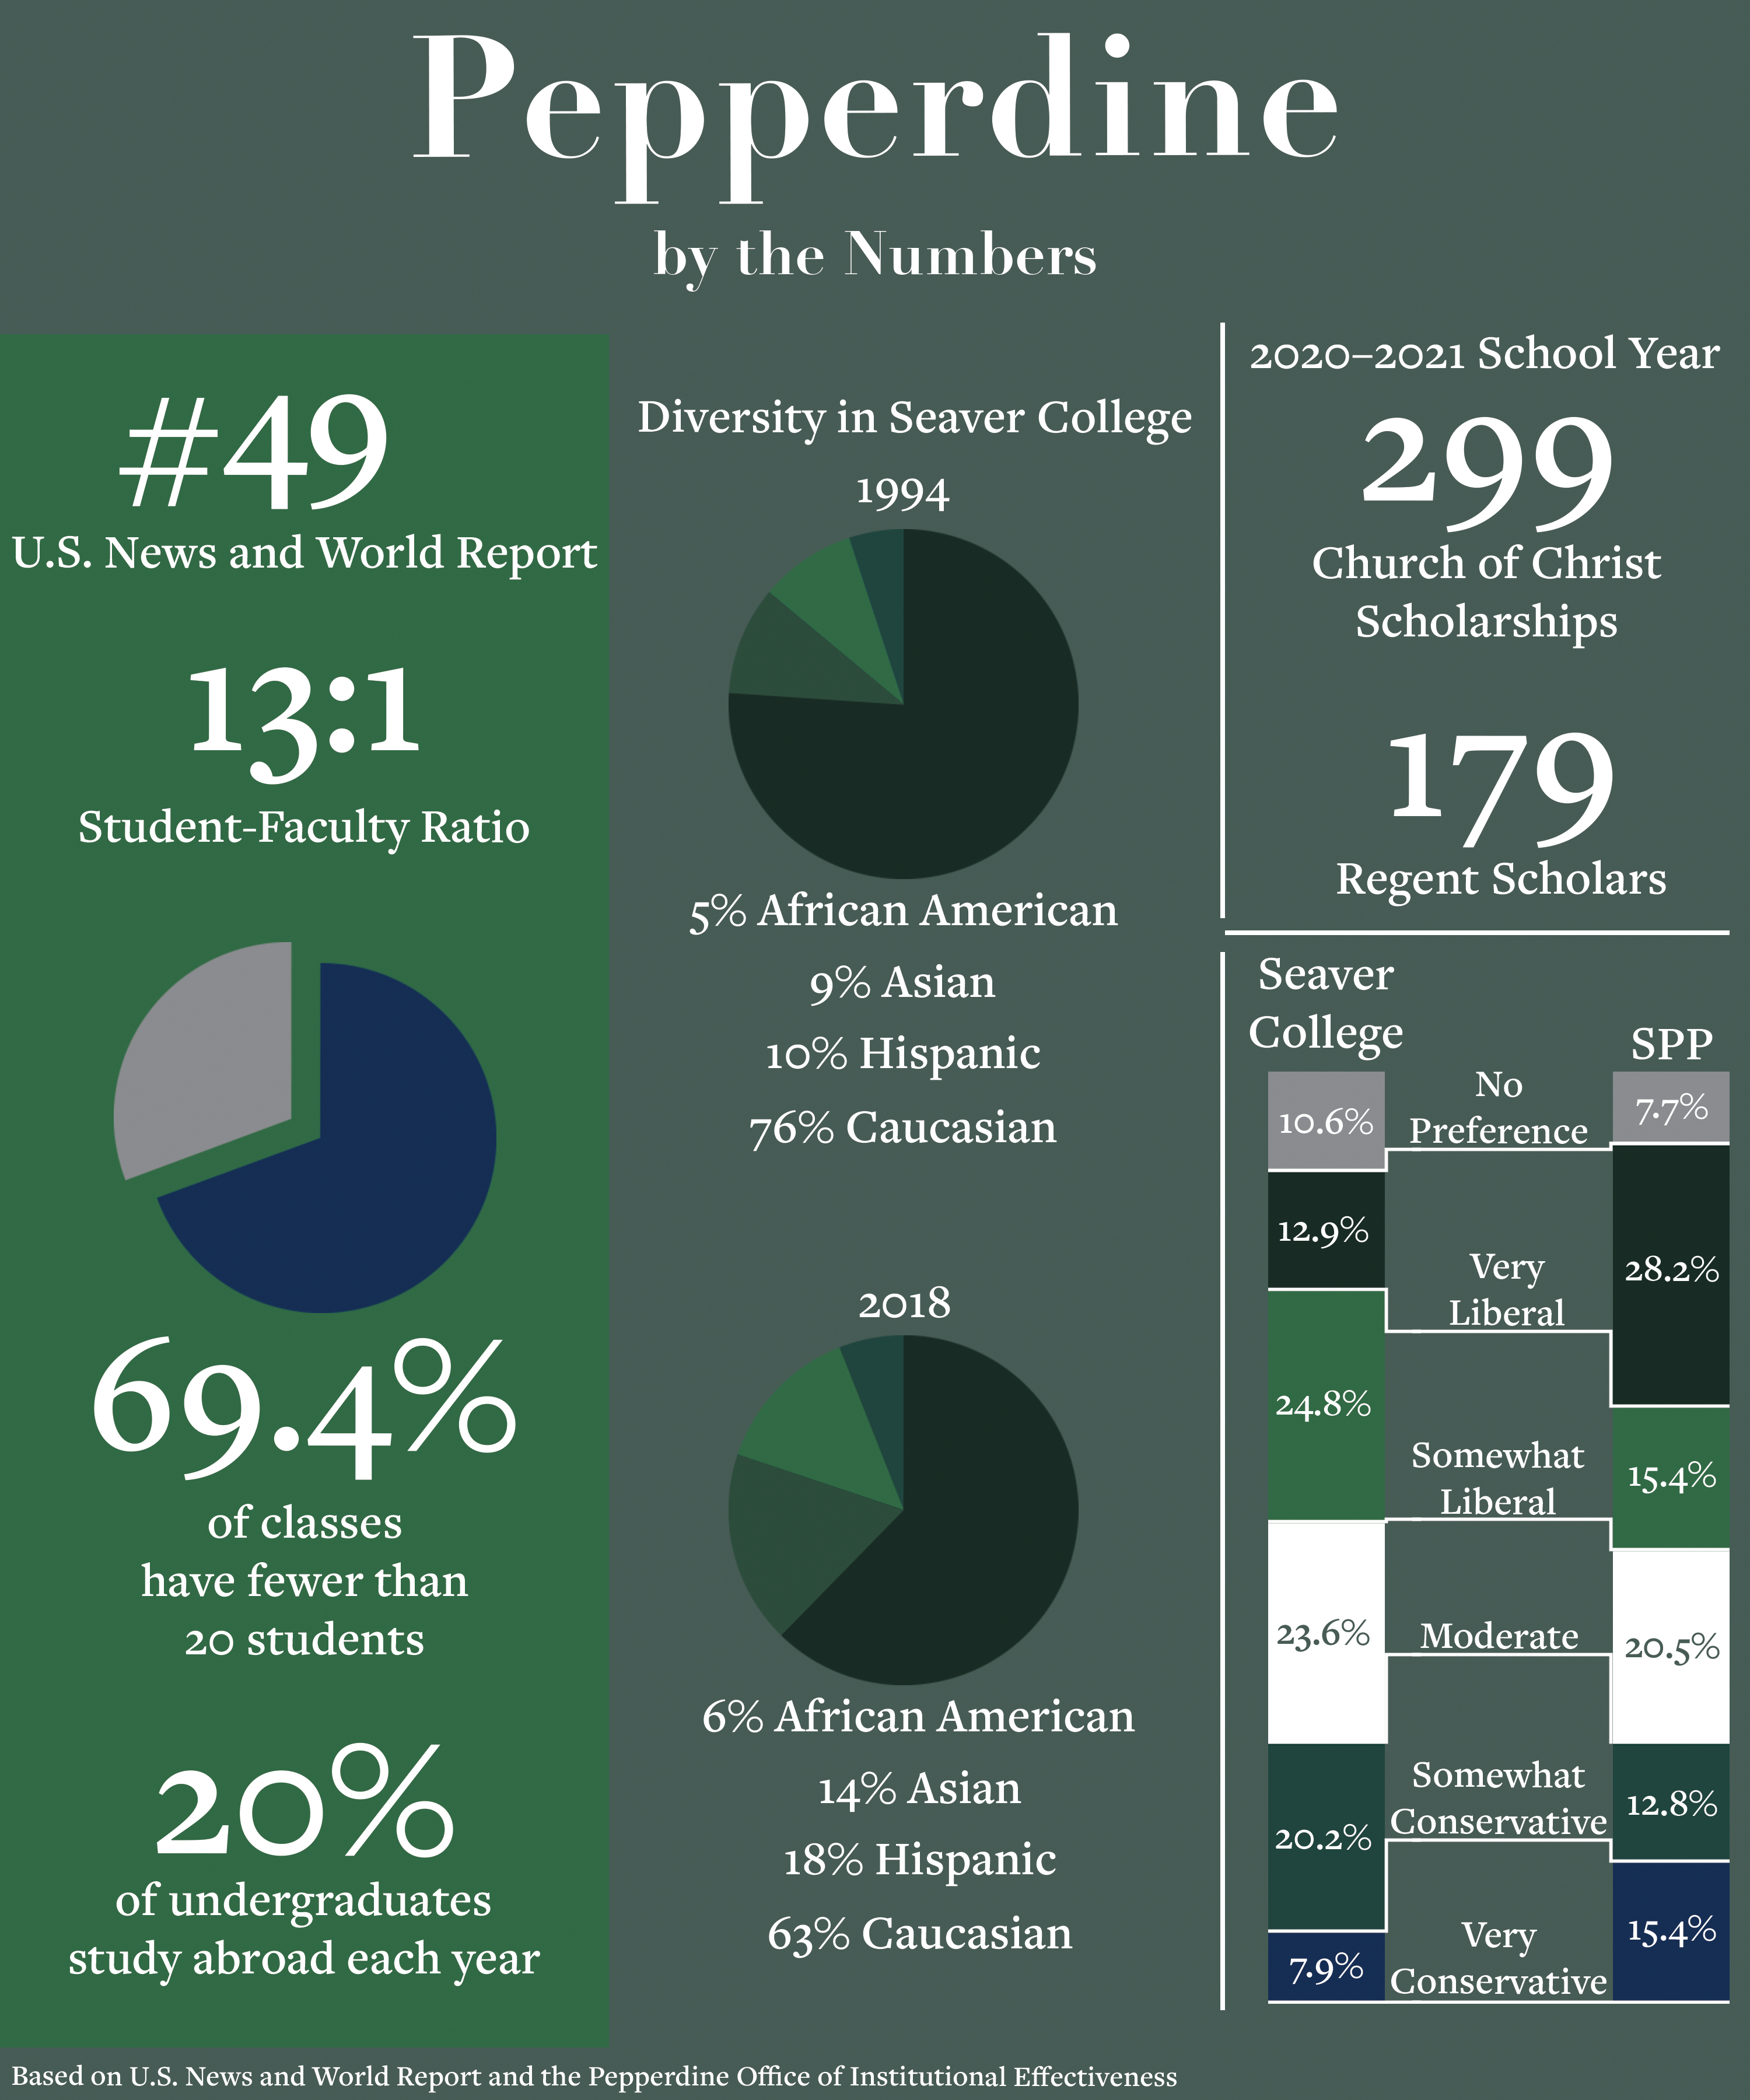
U.S. News and World Report lists Pepperdine’s student–faculty ratio as 13:1 and states 69.4% of classes have fewer than 20 students. The website takes these statistics into consideration when it ranks U.S. colleges every year, and Pepperdine landed at No. 49 on the list this year.
Chang and Hidalgo said Pepperdine’s top-50 ranking impressed them.
“It wasn’t really surprising that Pepperdine is ranked at the top, among other schools nationally,” Hidalgo said. “It wasn’t surprising to me just because Pepperdine is an amazing school.”
Mixed Statistics
Websites like U.S. News and World Report use simultaneously institutional and social statistics to help applicants compare schools. Diversity statistics fall into both categories because while they describe the racial, ethnic and gender composition of the students, the University has some control over those percentages.
Pepperdine aims to increase diversity among students, and it has accomplished this over the past few decades, according to the Office of Institutional Effectiveness. The OIE’s 2018–2019 Annual Diversity Report showed enrollment for Caucasian students fell between 1994 and 2018, while enrollment for Hispanic/Latinx, African American and Asian students increased.
The diversity report from 2018 lists the undergraduate population as 63% Caucasian, 18% Hispanic, 14% Asian and 6% African American. It lists the 1994 demographics as 76% Caucasian, 10% Hispanic, 9% Asian and 5% African American.
The increase in diversity shows the institutional control over enrollment, but current demographics describe the social reality of Pepperdine.
The University has similar control over other statistics that mostly fall into the social category, like the demographics of Pepperdine’s International Programs.
Pepperdine IP’s U.S. Study Abroad Reports for fall 2016 through summer 2019 show marginal changes in racial diversity among abroad participants. The share of participants from each class and the percentage of participants in each type of program — academic year, one semester, summer program, etc. — also remained consistent.
Over 800 American Pepperdine students went abroad each year, and the 2017–2018 and 2018–2019 reports stated over 150 international students studied abroad both years. Each year featured around 650 undergraduate participants, and Pepperdine’s undergraduate enrollment from 2017 was 3,368, meaning around 20% of undergraduates study abroad each year.
Pepperdine does not track the number of LGBTQ+ students attending the University.
Scholarship recipients may be the purest example of a both social and institutional statistic. According to the Office of Financial Assistance, 299 students received the Church of Christ scholarship this year. That scholarship is purely social, based on religious affiliation. Regents’ Scholars — like the 179 in 2019, according to the Dean’s Office — receive their scholarships at the discretion of the University based on their previous academic performances. The number of Regents’ scholarships and other grants Pepperdine awards represents institutional statistics.
Social Statistics
Few examples of social statistics exist because Pepperdine has so much control over the demographics of its student population.
Between 220 and 240 students request academic or housing accessibility accommodations every semester, according to the Office of Student Accessibility. These students need any number of accommodations, from emotional support animals to note takers.
The OIE Student Success Survey recorded students’ political affiliations. It found the largest percentage of Pepperdine undergraduates identify as “somewhat liberal,” followed by “moderate” and “somewhat conservative.” Each of Pepperdine’s schools had highest percentages in the “moderate” or “somewhat liberal” categories, except for the School of Public Policy, where the highest percentage was “very liberal,” despite the school having the highest percentage of “very conservative” students.
The number of students requesting accommodations and students’ political affiliations describe Pepperdine by solely describing its students, not the institution.
____________________
Follow the Graphic on Twitter: @PeppGraphic
Contact Kyle McCabe via Twitter: @kyledotmccabe or by email: kyle.j.mccabe@pepperdine.edu